Kur Europiečių pinigai nukeliauja ir kuri EU šalis daugiausia savo atlyginimo atiduoda mokesčiams, maistui, būstui, transportui ir kitoms reikmėms. Man labai įdomu pasidalinti naujausiais šių 2026 metų duomenimis žemiau. Neturiu LT kalba vertimo, tačiau bent jau vizualai padės susidėlioti bendrą vaizdą. Duomenys iš Eurostat'o.
The €100 math: for every €100 an employer spends on an average EU worker, ~€39 disappears in taxes before payday. Of the ~€61 that lands, roughly €14 goes to housing, €8 to food, €8 to transport. About €69 of the original €100 is spoken for before a single discretionary euro is spent — and VAT then taxes the rest again at checkout.
Loss no.1 - the tax wedge (the invisible ~39%). Across the EU and UK, a single average-wage worker lost 38.9% of their total labor compensation to taxes in 2025 — income tax plus employee and employer social contributions. Belgium is the worst at 50.8% (highest in the entire OECD), followed by Germany at 46.6% and Slovenia at 46.2%. Cyprus is the lightest at 26.4%, then Malta and the UK at 29.2%. Lithuania sits at 40.1% — above the European average
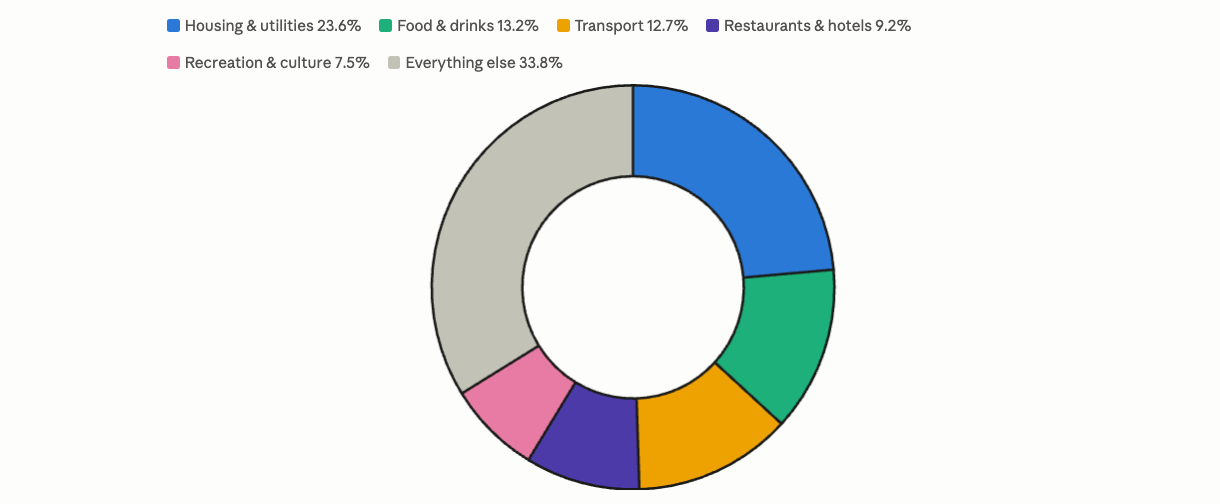
Loss #2 — housing. Almost a quarter of EU household spending (23.6%) goes to housing, water, electricity, gas and fuels — the single largest expense category. The spread is brutal: from 8.4% of household budgets in Malta to 49.2% in Hungary.
Loss #3 and #4 — food and transport. Food takes 13.2%, transport 12.7%. Housing, food and transport together consume roughly half (49.5%) of all EU household spending.
On the profit side: the leak is employer-side social contributions, which are part of labor cost but never seen by the worker. French employers paid 26.7% of labor costs in social contributions — the highest in the OECD — and employer contributions exceed 20% of labor costs in Austria, Belgium, Czechia, Estonia, Italy, Slovakia, Spain and Sweden.